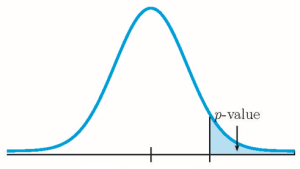
Because the alternative hypothesis is a [latex]\gt[/latex], this is a right-tail test. The p-value is the area in the right-tail of the distribution.
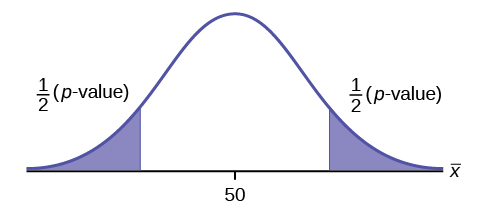
Suppose the hypotheses for a hypothesis test are:
[latex]\begin H_0: & & p=50 \% \\ H_a: & & p \neq 50\% \end[/latex]
Because the alternative hypothesis is a [latex]\neq[/latex], this is a two-tail test. The p-value is the sum of the areas in the two tails of the distribution. Each tail contains exactly half of the p-value.
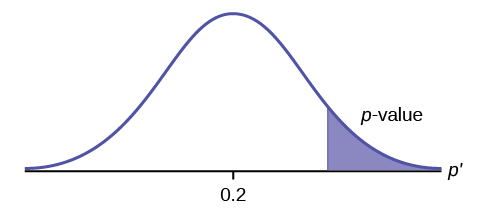
Suppose the hypotheses for a hypothesis test are:
[latex]\begin H_0: & & p=10\% \\ H_a: & & p \lt 10\% \end[/latex]
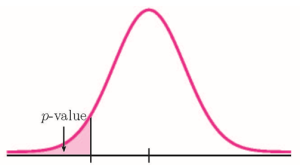
Because the alternative hypothesis is a [latex]\lt[/latex], this is a left-tail test. The p-value is the area in the left-tail of the distribution.
The p-value for a hypothesis test on a population proportion is the area in the tail(s) of distribution of the sample proportion. If both [latex]n \times p \geq 5[/latex] and [latex]n \times (1-p) \geq 5[/latex], use the normal distribution to find the p-value. If at least one of [latex]n \times p \lt 5[/latex] or [latex]n \times (1-p) \lt 5[/latex], use the binomial distribution to find the p-value.
If both [latex]n \times p \geq 5[/latex] and [latex]n \times (1-p) \geq 5[/latex]:
[/latex].
If at least one of [latex]n \times p \lt 5[/latex] or [latex]n \times (1-p) \lt 5[/latex]:
Marketers believe that 92% of adults own a cell phone. A cell phone manufacturer believes that number is actually lower. In a sample of 200 adults, 87% own a cell phone. At the 1% significance level, determine if the proportion of adults that own a cell phone is lower than the marketers’ claim.
Solution:
Hypotheses:
From the question, we have [latex]n=200[/latex], [latex]\hat
=0.87[/latex], and [latex]\alpha=0.01[/latex].
To determine the distribution, we check [latex]n \times p[/latex] and [latex]n \times (1-p)[/latex]. For the value of [latex]p[/latex], we use the claim from the null hypothesis ([latex]p=0.92[/latex]).
[latex]\begin n \times p & = & 200 \times 0.92=184 \geq 5 \\ n \times (1-p) & = & 200 \times (1-0.92)=16 \geq 5\end[/latex]
Because both [latex]n \times p \geq 5[/latex] and [latex]n \times (1-p) \geq 5[/latex] we use a normal distribution to calculate the p-value. Because the alternative hypothesis is a [latex]\lt[/latex], the p-value is the area in the left tail of the distribution.
| Function | binom.dist | Answer |
| Field 1 | 45 | 0.2710 |
| Field 2 | 50 | |
| Field 3 | 0.93 | |
| Field 4 | true |
So the p-value[latex]=0.2710[/latex].
Conclusion:
Because p-value[latex]=0.2710 \gt 0.01=\alpha[/latex], we do not reject the null hypothesis. At the 1% significance level there is not enough evidence to suggest that the proportion of visitors who make a purchase is lower than 93%.
A drug company claims that only 4% of people who take their new drug experience any side effects from the drug. A researcher believes that the percent is higher than drug company’s claim. The researcher takes a sample of 80 people who take the drug and finds that 10% of the people in the sample experience side effects from the drug. At the 5% significance level, determine if the proportion of people who experience side effects from taking the drug is higher than claimed.
Solution:
Hypotheses:
From the question, we have [latex]n=80[/latex], [latex]\hat
=0.1[/latex], and [latex]\alpha=0.05[/latex].
To determine the distribution, we check [latex]n \times p[/latex] and [latex]n \times (1-p)[/latex]. For the value of [latex]p[/latex], we use the claim from the null hypothesis ([latex]p=0.04[/latex]).
[latex]\begin n \times p & = & 80 \times 0.04=3.2 \lt 5\end[/latex]
Because [latex]n \times p \lt 5[/latex] we use a binomial distribution to calculate the p-value. Because the alternative hypothesis is a [latex]\gt[/latex], the p-value is the probability of getting at least 8 successes in 80 trials. (Note: In the sample of size 80, 10% have the characteristic of interest, so this means that [latex]80 \times 0.1=8[/latex] people in the sample have the characteristic of interest.)
| Function | 1-binom.dist | Answer |
| Field 1 | 7 | 0.0147 |
| Field 2 | 80 | |
| Field 3 | 0.04 | |
| Field 4 | true |
So the p-value[latex]=0.0147[/latex].
Conclusion:
Because p-value[latex]=0.0147 \lt 0.05=\alpha[/latex], we reject the null hypothesis in favour of the alternative hypothesis. At the 5% significance level there is enough evidence to suggest that the proportion of people who experience side effects from taking the drug is higher than 4%.
The hypothesis test for a population proportion is a well-established process: